Graphs in Math: 4 Types of Graphs
Written by MasterClass
Last updated: Feb 16, 2023 • 3 min read
Graphs track and measure data related to different objects. Learn about the different types of and uses for graphs here.
Learn From the Best
What Is a Graph in Math?
A graph in math is a data structure, which is a pictorial representation of a data network or a group of related objects. Graph theory is the study of how graphs connect and measure related objects for the purposes of finding the shortest path in a network. It’s also the cornerstone of discrete mathematics, which deals with integers, or finite numbers without decimals or fractions, and includes number theory, probability, computer science, and algorithms.
There are two kinds of graphs—directed and undirected—that refer to the direction of the edges on the graph. Directed edges travel in one direction, while undirected graphs travel bidirectionally, or in more than one direction. Some graphs, called mixed graphs, contain both directed and undirected edges. Most two- and three-dimensional graphs feature a pair of perpendicular lines, or lines at a ninety-degree angle: a horizontal axis, or x-axis, and a vertical axis, or y-axis, which meet a point on the graph called the origin. Graphs use the attribution of data to the nodes and vertices to provide information, which is measured with quadratic equations.
Graph vs. Chart
The terms “graph” and “chart” are often used interchangeably but do not have the same meaning. Chart is an umbrella term for any pictorial representation of information, including graphs and diagrams. Graphs are types of charts that present the mathematical connection between sets of numbers in pictorial form.
Graph vs. Matrix
The words “graph” and “matrix” are also used as synonyms in math but also refer to different data structures. A graph shows the relationship between two data sets, while a matrix is any number of rectangular structures containing data that apply to many different mathematical scenarios, including graph theory. For example, an adjacency matrix is a simple square matrix used to find adjacent pairs of vertices.
What Is the Function of a Graph in Math?
The function of a graph is a set of ordered pairs (a pair of objects in a specific order) that serve as Cartesian coordinates, or pinpoints on a plane in two-dimensional space. The objects on a graph in math are data sets represented by finite points on the graph, known as a set of vertices or nodes, and the finite straight lines that connect to any two nodes are a set of edges or links. Mathematics often use “graph” or “graph function” as synonyms for function of a graph.
4 Types of Graphs and What They Are Used For
There are many different types of graphs, each with a specific mathematical or statistical purpose. They include:
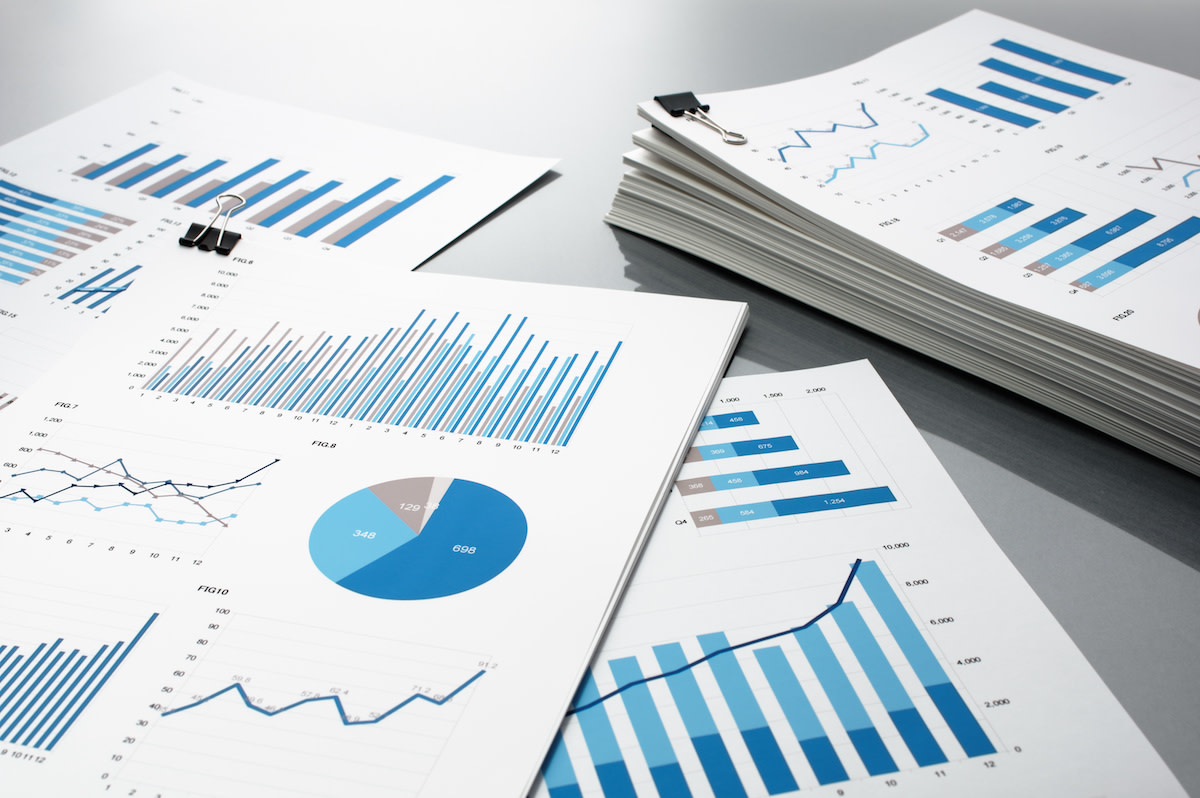
- 1. Bar graphs: Also known as bar charts or bar diagrams, bar graphs are common graphs for measuring information with vertical or horizontal rectangular bars. They are among the easiest ways to compare variables in data sets, such as different categories of a particular item and the frequency distribution, or how often they are used. A histogram resembles a bar chart, but you can use it to measure continuous data, or data with no finite end, such as financial or health data.
- 2. Line graphs: A line graph, which is also known as a linear graph or trend plot, shows information changes over a specific time period by connecting data points with straight lines. Though line graphs have many uses, businesses frequently use them to track changes in value, such as pricing or securities, or to visualize changes in market or business trends.
- 3. Pie graphs: Pie graphs are more commonly known as pie charts or circular graphs, and show how a whole data set is broken down into different categories. A“slice” of the pie represents each category, and the size of the slice indicates the percentage of data within that category and its relationship to the whole. Pie graphs help companies determine how much revenue comes from different products, as well as customer demographics.
- 4. Trigonometric graphs: Trigonometric graphs detail the repeating intervals of the main functions in trigonometry—the sine, cosine, tangent, secant, cosecant, and cotangent—as well as their inverse functions. Trigonometric graphs help to model many different scientific and natural data—including acoustics, levels of ultraviolet light, growth rates—that are measured in curved wave patterns, such as parabolas and hyperbolas.
Learn More
Get the MasterClass Annual Membership for exclusive access to video lessons taught by science luminaries, including Terence Tao, Bill Nye, Neil deGrasse Tyson, Chris Hadfield, Jane Goodall, and more.
